Editor’s note: This restored technical overview has been reconstructed from archival project traces, package descriptions, and related scientific computing references to preserve the historical and workflow context of the Illuminator library.
Illuminator was not built to make simulation output merely look better. It addressed a more practical problem: how to inspect, store, and move field data when the computation itself was already distributed across multiple processes. In early PETSc-oriented scientific workflows, that problem was not cosmetic. A solver could run in parallel, but interpretation often lagged behind because output, rendering, and storage were still treated as afterthoughts.
That is what made Illuminator distinctive. It sat close to the simulation rather than waiting for a fully detached post-processing stage. Instead of treating visualization as something that happened only after data had been flattened, exported, and manually reorganized, the library operated inside the same ecosystem as the distributed arrays that many continuum and phase-field calculations were already using.
On the original MatForge page, Illuminator was described in only a few lines as a distributed visualization package closely linked with PETSc’s distributed array objects, but usable independently as well. That short description was accurate, but it left out the real value of the project: Illuminator helped connect numerical work, visual interpretation, and distributed data handling into one coherent workflow.
Who This Article Is For
- Researchers working with PDE-driven simulations on structured or distributed data layouts
- Readers studying the history of scientific visualization and cluster-era software design
- Developers interested in how storage, rendering, and timestep monitoring were integrated in earlier research tools
- Students trying to understand why visualization infrastructure mattered in practical simulation workflows
What Illuminator Was Built to Solve
Scientific simulations often produce data that is easiest to compute in parallel and hardest to interpret at scale. Once a model is split across processors, the question is no longer just whether the solver converges. The next challenge is whether the evolving field can be viewed, saved, and revisited without collapsing the workflow into a pile of ad hoc exports.
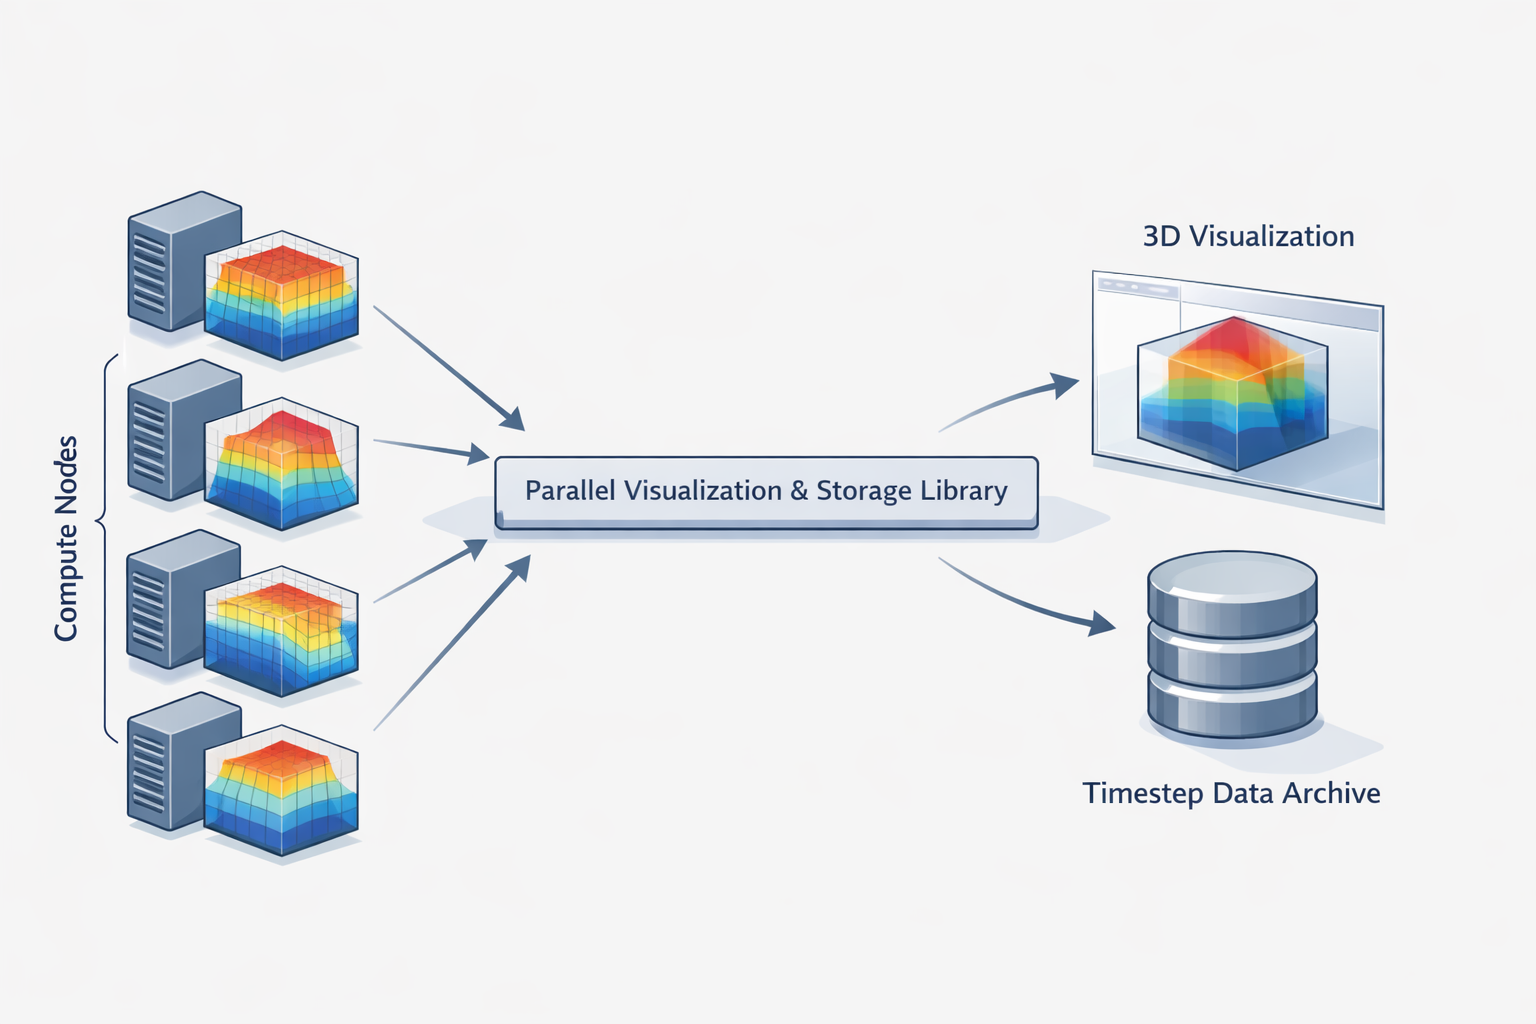
Illuminator emerged in that gap. Its historical descriptions point to three tightly connected purposes: viewing contour surfaces from PETSc 3-D distributed array objects, saving distributed data in the IlluMulti binary format, and supporting timestep-oriented inspection through companion tools and demos. That combination is more revealing than it first appears. It means the library was not just a renderer and not just a file format. It was workflow infrastructure for numerical work that was already happening in parallel.
Seen from today’s perspective, this is an early answer to a question that still matters: how close should visualization live to computation? Modern researchers ask the same thing when they discuss in situ analysis, memory pressure, and the cost of moving large simulation outputs around HPC systems. Illuminator belongs to an earlier generation of that conversation, but the underlying problem has not disappeared.
The Three Roles of Illuminator in Early Scientific Computing
The easiest way to understand the project is to stop treating it as a single-purpose graphics package. Illuminator made the most sense when it was performing three jobs at once.
1. Viewing distributed field data while the computation still mattered
One role was immediate visual interpretation. Package descriptions and demo code make clear that Illuminator supported contour-surface viewing for PETSc 3-D distributed arrays, with Geomview serving as a key rendering frontend. In practical terms, that meant a running or recently computed field could be inspected without first pretending it had been born as a neat, single-machine dataset.
This matters more than it sounds. Good simulation practice depends on seeing whether a result is physically plausible, numerically stable, and worth continuing to compute. That is why visualization is part of the modeling process rather than an afterthought. Illuminator’s value was that it helped make that principle operational in a distributed setting.
2. Preserving distributed outputs in a workflow-friendly form
The second role was storage. Historical package descriptions consistently mention distributed storage and retrieval of PETSc distributed arrays in the IlluMulti binary format, optionally with compression. That storage layer is easy to overlook, but it is central to the project’s identity. A visualization system becomes much more useful when it preserves not only the final image, but the underlying numerical state in a form that can be revisited, replayed, or compared across timesteps.
For researchers, this turns “I saw something interesting during the run” into “I can inspect that state again later.” It also turns one-off visual checks into reusable technical evidence.
3. Connecting timestepping, monitoring, and later analysis
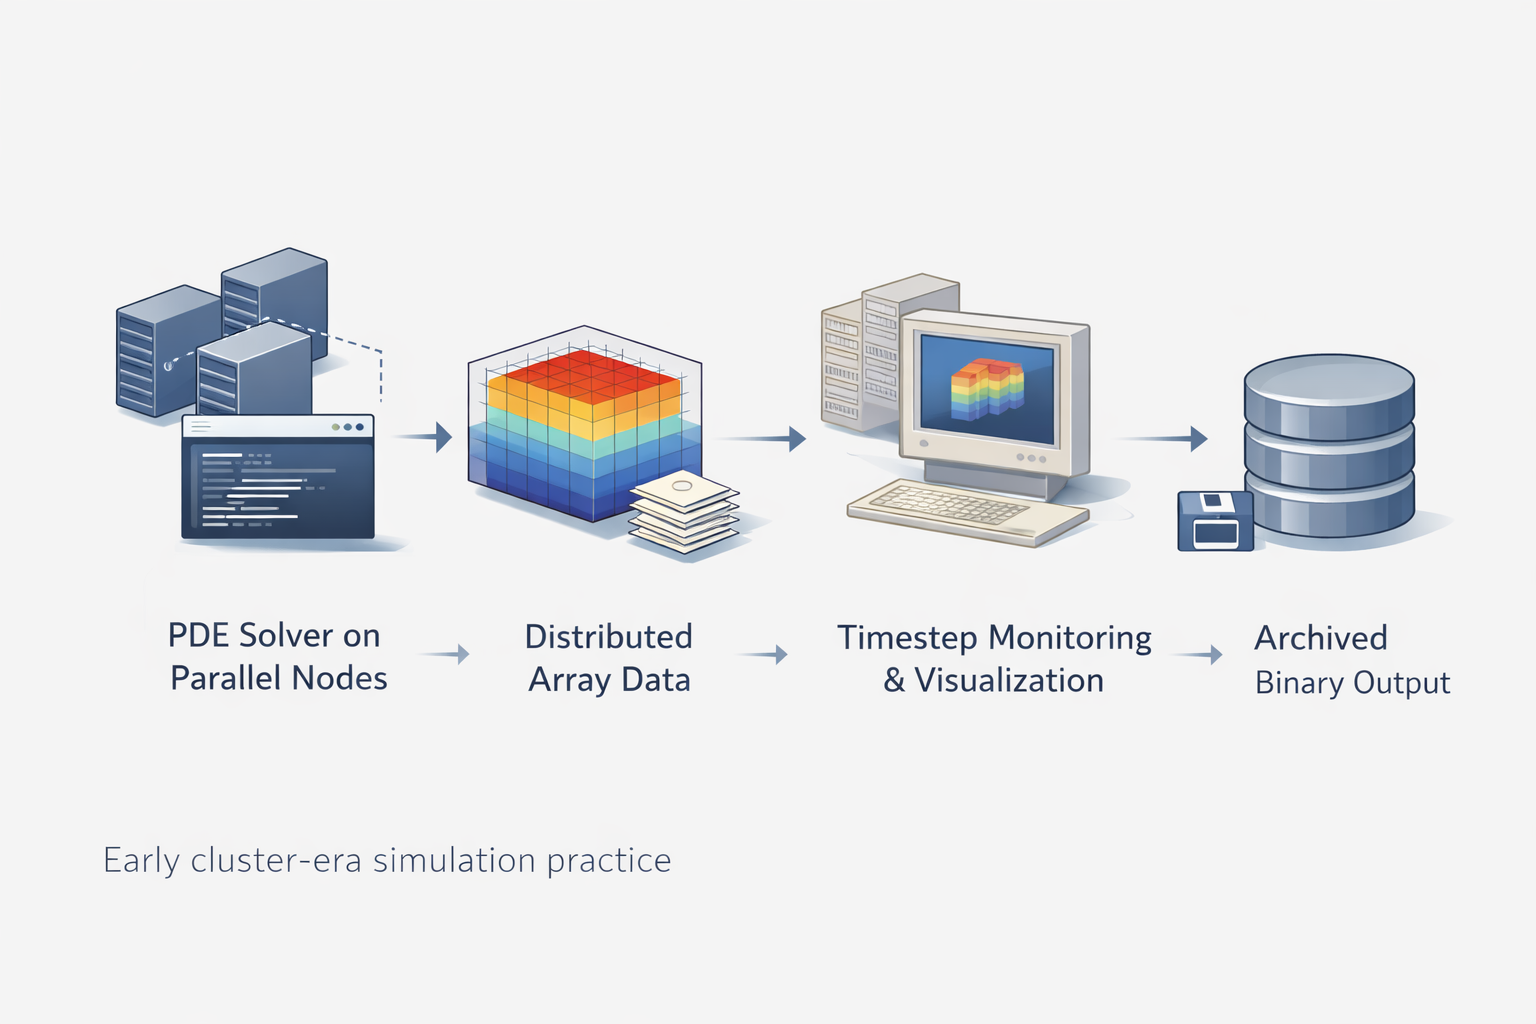
The third role was orchestration across time. Source traces from the Debian-packaged code show companion tools such as chts, chui, 3dgf, tsview, and tsview-ng. The Cahn–Hilliard demo is especially revealing because it uses Illuminator for contour display and optional saving during timestepping. In other words, the library participated in the rhythm of the simulation itself.
That workflow orientation is what elevates Illuminator above a thin label like “visualization library.” It was part renderer, part storage mechanism, and part practical bridge between numerical timestepping and human interpretation.
| Capability | Practical Meaning | Why It Mattered |
|---|---|---|
| Geomview-based contour viewing | Displayed 3-D distributed field structures in a form humans could inspect | Made evolving numerical states easier to diagnose and interpret |
| IlluMulti distributed storage | Saved simulation data in a workflow-oriented binary format | Preserved timestep states for later review, comparison, and reuse |
| Timestep viewing tools | Supported sequential inspection of time-dependent outputs | Connected simulation progress with visual monitoring |
| Demo applications such as Cahn–Hilliard and 3D Green’s function viewing | Showed how the library fit inside real numerical workflows | Grounded the project in scientific use rather than abstract software claims |
| Tight PETSc adjacency | Worked naturally with distributed array-based computational setups | Reduced friction between solving, saving, and interpreting results |
Components, Frontends, and the Shape of the Toolchain
One of the most useful clues about Illuminator comes from the surviving build metadata. It shows that the project was not a lone executable but a small ecosystem: a core library, timestep viewers, Geomview-enabled demos, and supporting interfaces. Even without a polished modern documentation site, that surviving structure tells us how the authors thought about scientific software. They were building a toolchain, not a screenshot generator.
Geomview appears in the archival traces as the visualization frontend for contour-style display, while tools such as tsview and tsview-ng suggest a deliberate concern for timestep-oriented navigation. The 3dgf program points toward function visualization, and chts shows the library living inside a concrete Cahn–Hilliard simulation workflow. This is exactly the kind of design that makes sense in research software: not one giant all-purpose interface, but a set of small, composable pieces close to the numerical problem.
There is also an architectural lesson here. In simulation projects, the most valuable software is often not the glamorous solver alone. The supporting pieces that help users inspect states, preserve intermediate results, and understand evolving fields can determine whether the entire workflow remains usable under real research conditions.
Why Illuminator Mattered in Parallel PDE Workflows
To see why the project was more than a niche utility, it helps to place it inside the larger reality of PDE-based scientific computing. Once simulations become large enough, the difficulty is never confined to the equation set. Researchers also have to manage data layout, communication overhead, memory use, timestepping, solver diagnostics, and the practical question of what exactly to save at each stage. That is why large-scale PDE work becomes an engineering workflow as much as a mathematical one.
Illuminator belongs to that workflow layer. PETSc distributed arrays made it possible to represent structured field data across processes. But representation alone does not answer how a user checks morphology during phase separation, inspects a field during a long run, or preserves meaningful states without exporting everything into disconnected post-processing steps. A library that can both display and store distributed numerical data starts solving those problems at the place where they actually occur.
This is also why the project fits naturally into the broader MatForge ecosystem. Early materials-modeling codes were rarely isolated pieces of mathematics. They were bundles of numerical methods, solver choices, data structures, visualization habits, and practical compromises. That same pattern appears in neighboring projects such as RheoPlast, where performance, PETSc adjacency, and research-focused simulation design were central to the code’s identity.
The deeper significance of Illuminator is that it reveals how much scientific computing depends on intermediate software layers. Researchers often remember the solver and the published result. What gets forgotten are the tools that made interpretation possible while the work was still unfolding. Illuminator lived precisely in that middle layer between computation and understanding.
Not an Active Product Page, but an Important Archival Resource
These archival resources are best understood as historical and educational references rather than active software distributions.
That framing matters. A restored page like this should not pretend that every legacy scientific tool can be dropped into a modern environment without friction. The more honest value lies elsewhere: in preserving how researchers once organized parallel visualization, distributed storage, and timestep inspection around real computational problems.
For students and technically curious readers, Illuminator offers a compact lesson in scientific software design. It shows that visualization infrastructure used to be assembled much closer to the solver, that storage formats were part of the analytical workflow, and that small project-specific tools often carried a large share of the practical intellectual work.
For historians of software and for researchers maintaining old results, the project has another value. It documents a style of computational practice from a period when open research codes, PETSc-based architectures, and cluster-era workflow tooling were being shaped together rather than treated as separate concerns.
Why This Page Is Worth Restoring
Illuminator is worth preserving not because it was flashy, and not because every old codebase deserves sentimental revival. It is worth preserving because it captures a technical idea that remains relevant: scientific visualization is strongest when it is structurally tied to computation, storage, and interpretation rather than bolted on at the end.
The old MatForge stub hinted at that in miniature. A better restoration can finally say it clearly. Illuminator was an early distributed visualization and storage layer for PETSc-oriented scientific workflows, and its significance lies in the way it connected numerical field evolution, timestep-aware inspection, and reusable output handling inside one practical research environment.